WorkFalcon Analytics
[CS 01]
How Falcon Analytics turns Dubai property data into unit-level decisions
A conversation with
 Omri ZerData Expert @ Falcon Analytics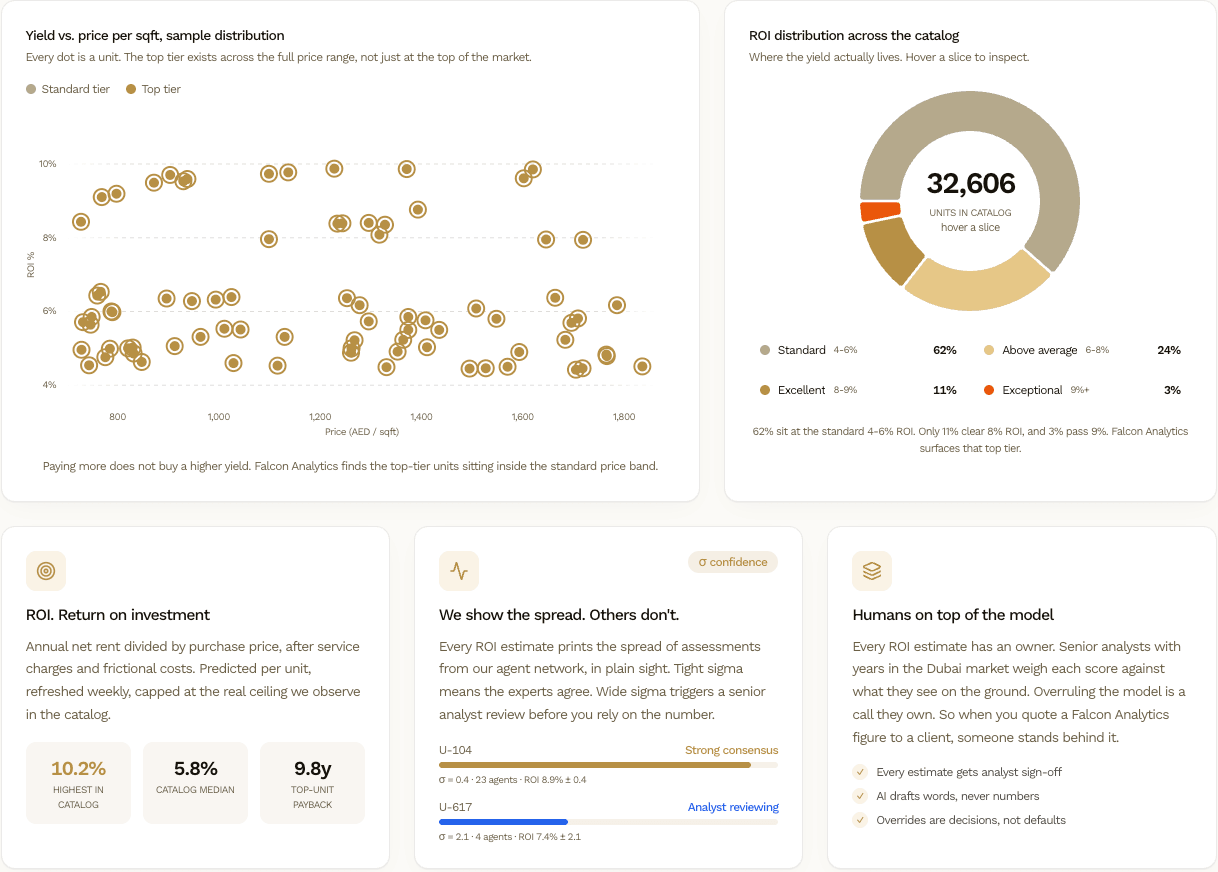
Challenge
Dubai property decisions were being made on project averages and broker intuition. Inventory, registered transaction history, rental data, and lead pipelines each lived in a different tool, so nobody could rank individual units by what they would actually return.
Solution
One platform covering the whole deal cycle: a live catalog of every off-plan unit scored on projected yield, official transaction data alongside it, a vetted distress feed, and a CRM that matches those units to a buyer's criteria automatically.
Results
- The full Dubai off-plan catalog indexed and refreshed weekly: 32,606 units across 727 projects and 134 developers.
- Registered sale data back to 2010 queryable in seven views, every one exportable and shareable.
- Yield estimates ship with a confidence spread, so a wide sigma routes to analyst review before anyone quotes the number.
- Three-tier subscription live end to end, from the free distress marketplace through to the full platform.
Falcon Analytics scores every unit in the Dubai off-plan market on projected rental yield, pairing machine learning with analyst sign-off. Gridline owned architecture, design, engineering, QA, and brand: one team from concept to shipped product.
Project averages hide the unit that pays back
A Dubai development can hold hundreds of apartments, and the spread of returns inside a single building is wider than the spread between buildings. Quote the project average and you miss the unit that actually performs: the floor, the view, the layout that clears well above what the tower does as a whole.
Across the catalog, 62% of units sit in a standard 4–6% band. Only 11% clear 8%, and 3% pass 9%. Finding that top tier is the entire job, and paying more per square foot does not get you there; the best-performing units sit inside the ordinary price band.
“We needed a partner who could see the whole funnel, from first touch to recurring value. Gridline brought that view and translated it into a focused product plan.”
Omri ZerData Expert @ Falcon AnalyticsA yield estimate with a human on top of the model
Every unit gets its own annual rental yield estimate rather than inheriting its project's. Vetted local agents estimate yearly rent, the model weights those estimates and strips outliers, and the spread of assessments is scored for confidence.
That spread is published rather than hidden. A tight sigma means the agent network agrees; a wide one triggers senior analyst review before the figure reaches a client. Analysts can override the model, and the override is recorded as a decision with an owner.
- Every estimate carries analyst sign-off
- AI drafts the words, never the numbers
- Overrides are decisions, not defaults
The whole deal cycle behind one login
Scoring units is only useful if the rest of the workflow is in the same place. The platform runs from finding inventory through to closing: filter the catalog, check the numbers against registered transaction data, match a buyer, generate a branded report, and move the lead through the pipeline.
- Data Explorer over roughly 1.5 million registered DLD sales going back to 2010: no listings, no asking prices
- A vetted distress feed averaging 13% below market, with VIP access 48 hours ahead of the free tier
- Lead CRM that ranks the full catalog against a buyer's budget, minimum yield, and excluded developers
- Nine-page investor reports delivered under the agent's own branding
- Location intelligence using real driving times, not straight-line distance
Market AI sits across the same data tools the rest of the platform exposes, answering questions in plain language and naming the tools behind every reply, so a figure can be traced before it reaches a buyer.
Ship your next product with one team
One partner for design and build. Clear direction, no handoffs, from concept to launch.
Get in touch